(480) 656-7301
call for free consultation - available 24/7
Posted on November 17, 2016 in Crime
What is the most dangerous city in Arizona? What is the safest? When you’re examining the safety of your city in Arizona, it’s likely that the first thing you want to know is, “what’s the crime rate?” However, there is more to determining a city’s level of danger or safety than simply looking at crime.
With the help of data visualization firm 1Point21 Interactive, Orent Law Offices and criminal lawyer Craig Orent aimed to quantify which cities in Arizona (with populations over 10,000) are the safest and which are the most dangerous by looking at three key dimensions:
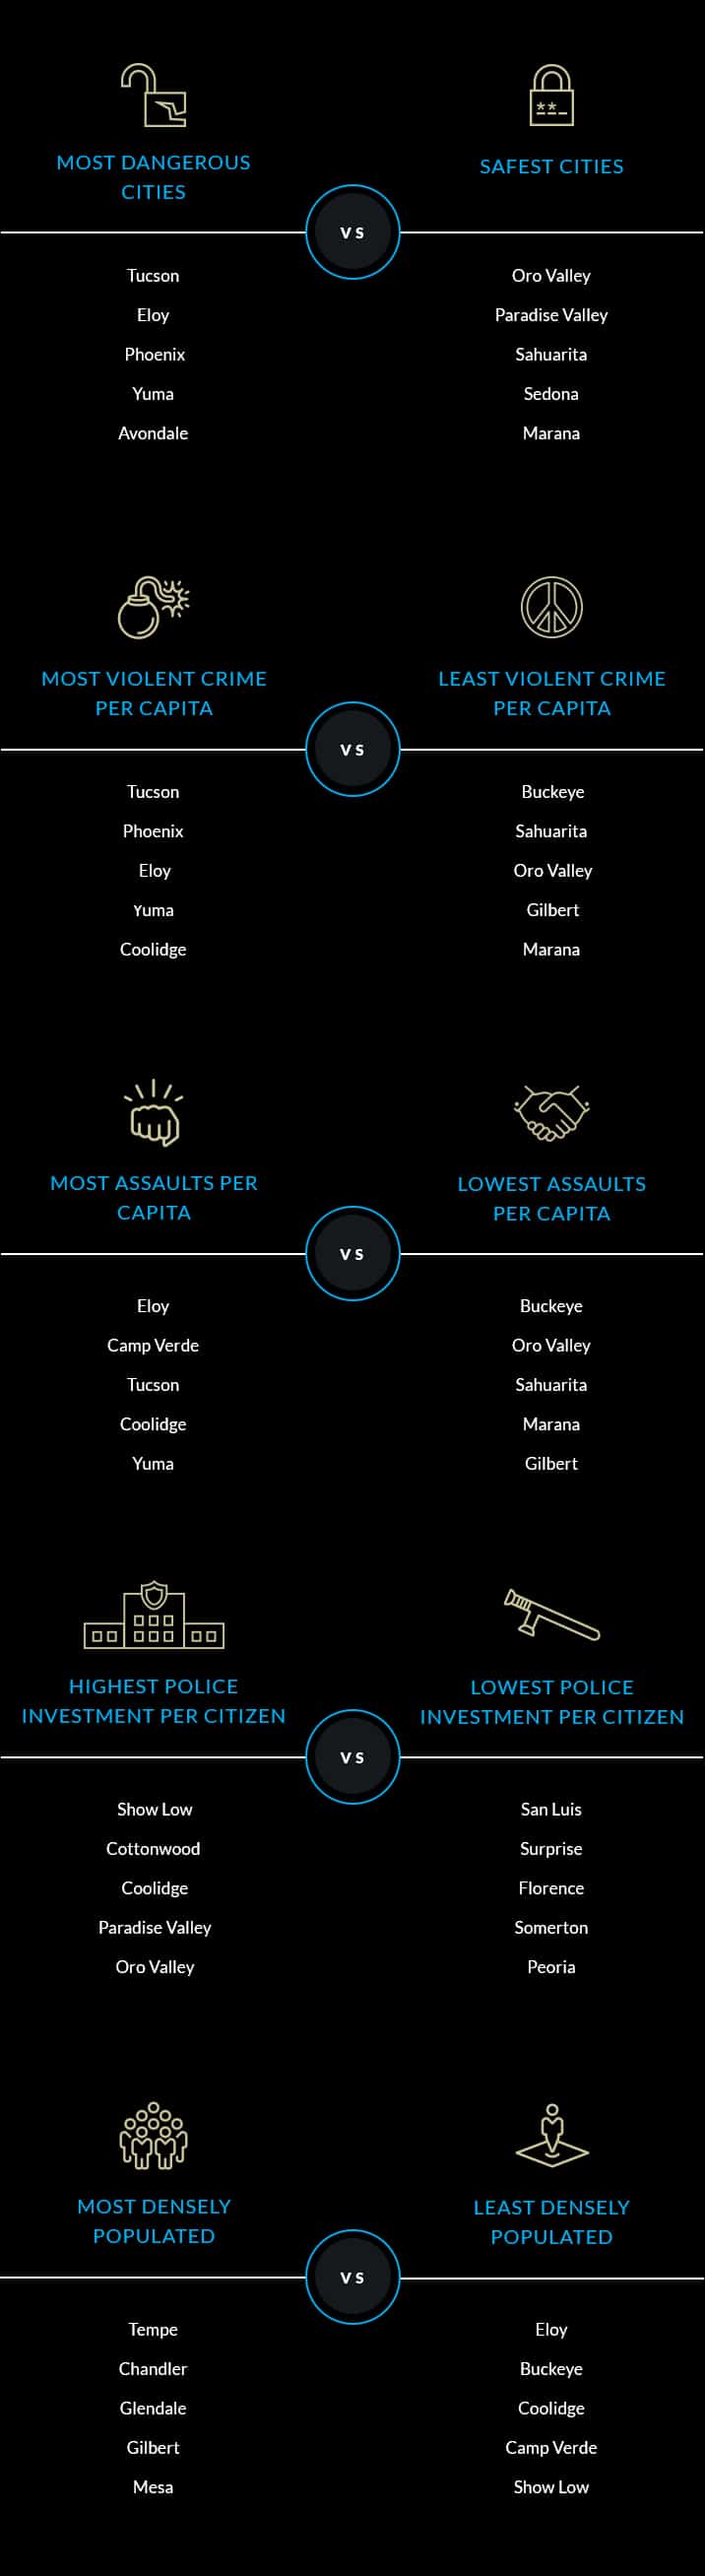
Within these dimensions, we collected and analyzed 14 different metrics. Based on our research, here are the most dangerous (and safest) cities in Arizona.
*In all categories, 1 is most dangerous or highest risk, while 40 is the safest or lowest risk
While crime doesn’t always tell the whole story, it’s a big part of it. Arizona violent crime – defined as murder and non-negligent manslaughter, forcible rape, robbery, and aggravated assault – is the biggest threat to personal safety, thus is weighed heaviest in our rankings.
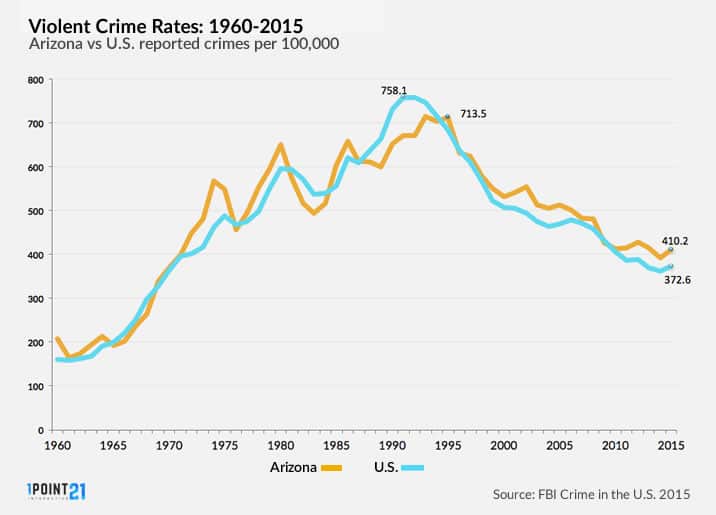
At the national level, the violent crime rate rose in 2015, after two years of historic lows. Similarly, Arizona saw an overall uptick in violent crime, with its violent crime rate resting a full 10 percent higher than the national rate.
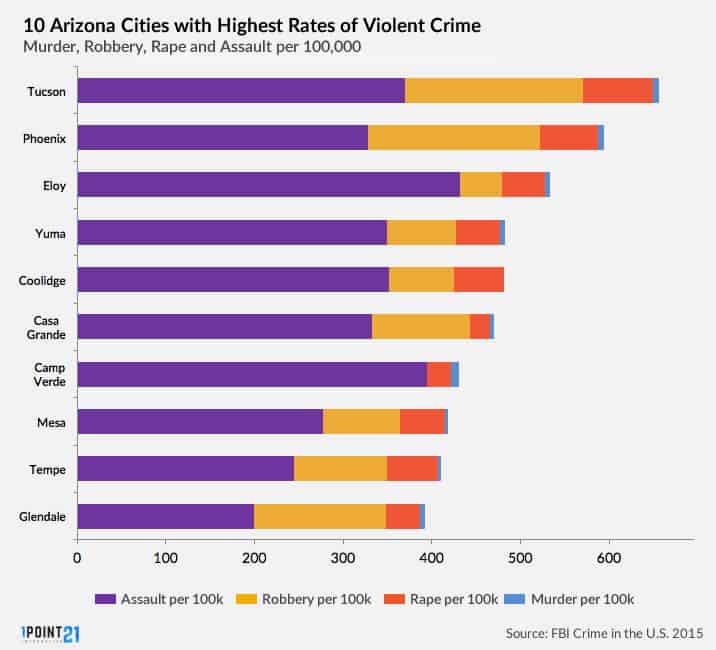
At the city level, Tucson had the highest violent crime rate in Arizona, with approximately 656 violent crimes per 100,000 residents, followed by Phoenix, Eloy, Yuma and Coolidge.
Crime reports alone cannot and should not be used to determine the relative danger of each city. In order to make a more valid and complete assessment, we did significant research into a wide range of factors acknowledged to affect the volume and type of crime that occurs from city to city.
The poverty rate and median income of a city’s residents are two important measures used to gauge an area’s financial well being. Beyond that, living in poverty has been shown to drastically increase the likelihood of being the victim of a violent crime. In fact, the U.S. Department of Justice notes in a special Bureau of Justice Statistics report that “persons living in poor households at or below the Federal Poverty Level had more than double the rate of violent victimization as persons in high-income households.”
This appears to hold true in Arizona. For example, the city of Eloy has the highest poverty rate of the cities in our study at 37.4 percent – nearly 3 times the national rate of 13.5 percent – and ranked fourth in our overall crime dimension. Marana had the lowest poverty rate at 4.9 percent and some of the lowest crime rates.
Our study looks into the percentage of residents that hold a high school degree along with the unemployment rate in each city. According to the School Library Journal, “dropouts are 3.5 times more likely to be arrested than high school graduates.” This wasn’t always true for Arizona; for example, San Luis only graduates 39 percent of its high school students, but the city ranked 29th in crime rate. Scottsdale graduates 94 percent of its students but actually had more aggregate crime, ranking twenty-fifth.
The lower the education the higher the rate of unemployment. Both of these factors seemed to have a much more adverse effect on burglary and theft, rather than violent crime. The city of Glendale, with seven percent unemployment and only 78 percent graduation rate ranked third in both burglary and theft.
It may sound ridiculous, but climate – notably, high temperature – has been linked to elevated rates of violent crime. Several studies have linked both high temperatures and incremental rises in temperature to an increased level of human violence and crime. Therefore, we collected average temperature data for each of the cities in our study to account for this factor.
One indicator of a city’s safety is its strength of a jurisdiction’s law enforcement agency. For our purposes, we looked into the size of each city’s law enforcement budget and the number of officers employed. According to the Bureau of Labor Statistics (BLS), Arizona has one of the highest average salaries for law enforcement in the country. On top of that, there is no shortage of openings across city departments. Phoenix, being the largest city in Arizona, has the highest budget allocation for its police department and employs by far the most police officers. However, on a per capita basis, Marana spent the most on law enforcement while Show Low has the most favorable ratio of officers to citizens.
Does a higher budget for the police translate to a lower crime rate? Not necessarily, but it stands to reason that two cities with similar crime rates While not uniform from top to bottom, our research shows that it certainly helps. Paradise Valley was one of the safest cities according to our rankings, and they spend $523 per citizen on their police department. On the other side of the coin, Show Low and Tempe spent the next most per citizen and were the second and sixth most dangerous cities, respectively.
We collected and analyzed data across three key dimensions – Crime, Police Presence and Investment, and Community Factors.
Within these dimensions, we identified and ranked 14 metrics that influence the safety of Arizona cities. Our data and rankings are a reflection of the following metrics and corresponding weights:
Crime data was sourced from the FBI’s Uniform Crime Reporting program and reflect data for 2015. All data was pulled from the “Offenses known to Law Enforcement” report.
Police department officer headcount and budget data was gathered from a combination of each city’s police department website, published city budgets, and phone calls/emails/tweets to each department.
Demographic information was gathered from the U.S. Bureau of Labor Statistics and Area Vibes.
For more information, contact the criminal defense attorney Craig Orent. Give us a call at (480) 656-7301 or visit our law office at 11811 N Tatum Blvd UNIT 3031, Phoenix, AZ 85028. We offer a free case evaluation, so get the help you deserve today.


